Mapping the world of print
As seen in FIPP’s Future of Print report, print’s share of the revenue of the major ‘published media’ sectors is currently much higher than many might assume. Print’s share is reducing, but not as fast as many believe.
The broader Entertainment and Media market
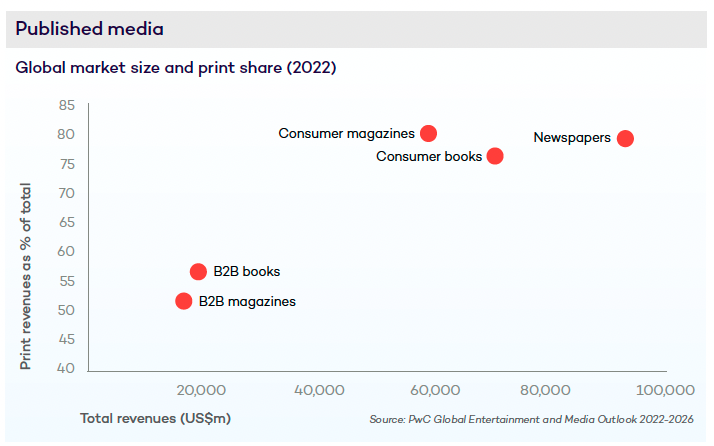
Data from the PwC Global Entertainment and Media Outlook 2022-2026 report provides 2022 global market sizes for the core “published media” segments in the broader Entertainment and Media (E and M) market. It estimates the relative importance of print products in each one.
Newspapers
This segment is by far the largest (US$93bn) and is still heavily dependent on print revenues from both advertising and copy sales: print accounts for 80% of total industry revenues currently.
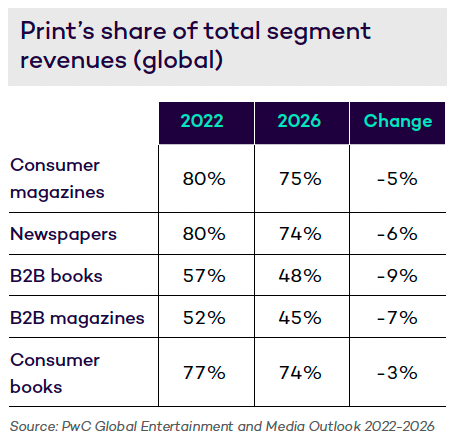
Total newspaper industry revenues are predicted to decline by -2.1% Compound Annual Growth Rate (CAGR) through to 2026. By then, print revenues are forecast to fall to a 74% share of total revenues: a significant drop, but not dramatically so.
Consumer magazines
This segment is just under two thirds the size of the newspaper business at US$59bn: print currently accounts for a similar 80% of total revenues.
Magazine revenues are predicted to decline at a similar rate to newspapers at -2.1% CAGR through to 2026. The fall in print revenues is slightly slower than for newspapers, with the print share ending up in 2026 at 75%, one percentage point higher than for newspapers. Yet circulations are predicted to hold up better than for newspapers. Instead, magazines will suffer significantly more from a reduction in print ad revenues than in print reader revenues.
B2B books and magazines
Books and magazines account for a small part of the massive and growing B2B segment (total value in 2022 is US$178bn), which is driven more by digital business information (68% of total industry revenues) and the recovering live events sector.
- B2B books account for US$19bn currently, where the print + audio sector makes up 57% of the total, dropping by 9% percentage points to 48% by 2026.
- B2B magazines account for a slightly smaller US$16bn sector. Here, the print share is the lowest of all the publisher segments at 52%, dropping by 7% points to 45% by 2026.
Consumer books
This is the most buoyant of all the publisher segments, with a positive predicted CAGR of +1.2% from its current US$71bn market size. The print share of the book industry currently stands at 77%. The predicted share by 2026 shows only a modest loss to 74%: the smallest fall of all the media segments.
All these global trends conceal a wide range from country to country, where the local dynamics, both among consumers and publishers, can vary markedly. Some markets remain very print skewed (which is often linked to strong newspaper sales), whereas others are moving much more rapidly away from print and into digital platforms.
The key conclusions:
- Print’s share of the revenue of the “published media” business is currently much higher than many actually assume.
- Print’s share is reducing, but not as fast as many believe. This
is happening as the growth in digital revenues is slowing down.
Zooming in on consumer titles
Although the other areas of “published media” will be referred to, the central focus of the rest of this report is on Consumer Magazines, where some of the most innovative print activity is taking place.
Total industry revenues
In the two years before the pandemic, the global Consumer Magazine industry was shrinking at an average -3.1% per year.
- 2020, the start year of the pandemic, saw total industry revenues plunging by -16% year-on-year (YoY).
- The 2022 recovery (+4% YoY) marked a downward step-change. Revenues returned to only 88% of 2019’s figures and well below what would have been expected had the pre-pandemic rate of decline simply continued.
- The future rate of fall is predicted to slow to a -2.1% CAGR in the 2023 to 2026 period.
Unpicking print and digital revenue streams
The graph below shows the long-term trend in the four key revenue streams tracked by PwC.
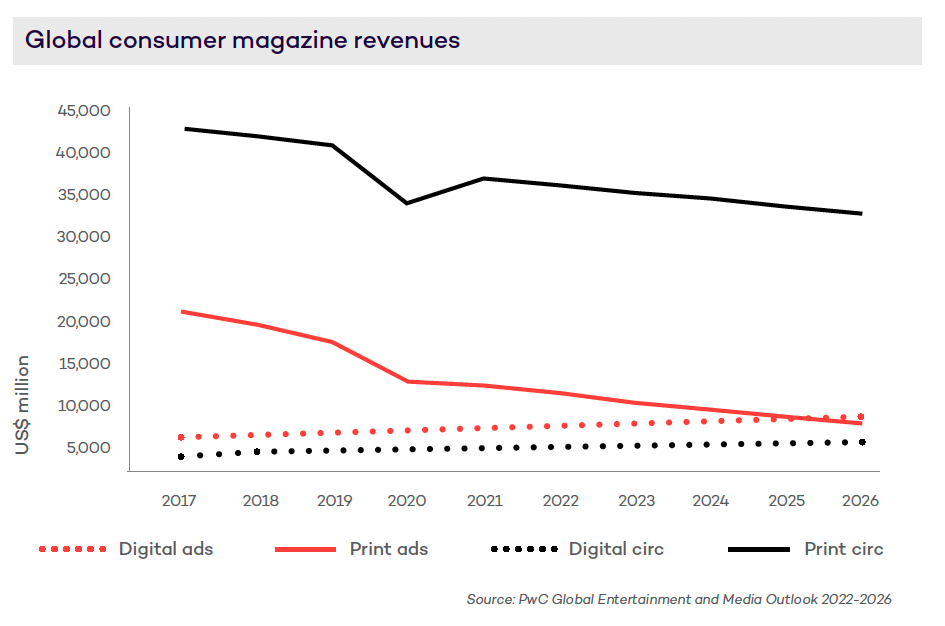
Print circulation is the dominant, though still declining, revenue stream. In 2022, it accounted for 61% of total industry revenues and for 89% of all circulation revenues. By 2026, these two shares are predicted to be 61% (steady) and 86% (-3% points) respectively.
- Pre-pandemic it was running down at an average -2.7% per year.
- 2020 saw a massive -17% drop due to the impact of lockdowns, on both consumer behaviours and retail distribution constraints. This also hit print advertising badly (-26%) and there was little compensation from any significant uplift in digital circulation revenues.
- 2021 saw a +9% clawback. Yet as with the topline revenues, this did not get back to 2019’s levels and was well below what would have been expected had the pre-pandemic rate of decline simply continued.
- From 2022 on, the average CAGR is forecast to be -2.4%, a slight slowdown in the pre-pandemic rate of fall.
Digital circulation is steadily growing currently at +4% per year, although this is predicted to slow to a +3% CAGR through to 2026. Also, it still represents only 11% of total circulation revenues currently, although this will rise to 14% by 2026. Most of the magazine digital activity has been in digital editions, but this is shifting closer to the newspaper model of paid-for website access with the linked deconstruction of the “issue” into article-level content.
Print advertising has been in long-term decline, dropping faster than circulation revenues. It was badly hit in 2021 (-26%), but its rate of fall has slowed down since then to -9%. Digital advertising has been growing steadily, but this has slowed down to +4% CAGR.
- Magazine advertising is more digitally skewed (39%) than is the case with circulation, where the digital share is only 11%.
- In 2025, the digital and print advertising streams are predicted to cross over, with digital becoming the bigger revenue source. Yet digital’s gains have not balanced print’s major losses.
Key conclusions
- The magazine revenue model is generally more skewed to circulation than ads. That bias continues to trend further towards circulation and reader revenues. Also, ads are much more erratic from year to year.
- Print accounts for a much bigger proportion of circulation revenues than it does for ads, where print is losing share to digital.
- Digital ads are simply not coming on-stream fast enough to compensate for the print losses.
- Taken together, print circulation plus print advertising currently accounts for 80% of all industry revenues. This share is reducing as the digital shift continues, but by 2026 it will still stand at a dominant 75%.
- As digital growth slows, the decline in print is also slowing. That highlights the need to refocus on extending the life of print.
Revenue geography
PwC tracks consumer magazines in 53 countries. What is clear from the data is that the revenue profiles vary markedly from country to country and from region to region, based on a range of drivers and variables. These include:
- The historic structure of the publishing industry and its own revenue models and routes to market.
- Consumer factors, notably age groups.
- The tech infrastructure and content delivery channels.
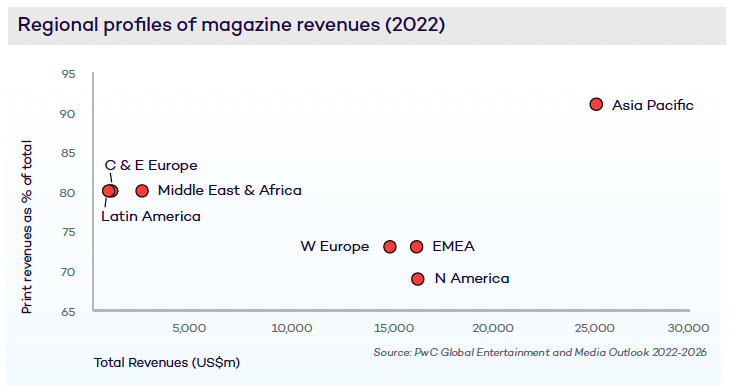
Regional print revenue
The most heavily print-skewed region is Asia Pacific (91%), which includes the print-heavy Chinese and Indian markets. At the other extreme, the most digital market is N America at 69% print.
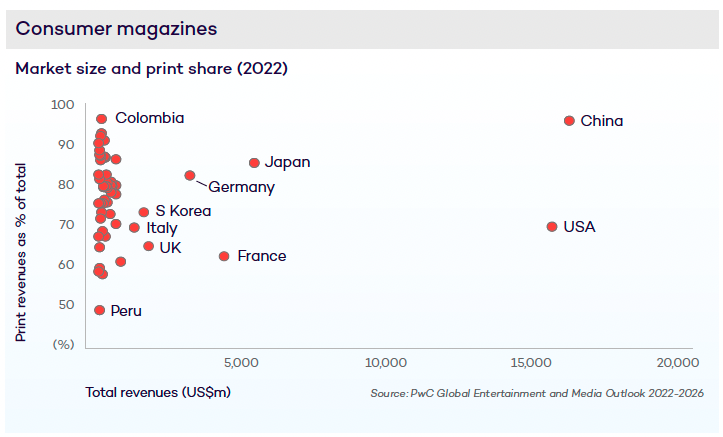
Country print revenue
When zooming in on individual countries, there is a massive range from the low 48% print dependence of Peru through to the 97% of Colombia. Also important is the massive 97% print skew of the world’s largest magazine market: China.
This insight article is part of the FIPP report The Future of Print, available only to FIPP members. You can download the full report here.
Not a FIPP member yet? You can sign up via the report page.