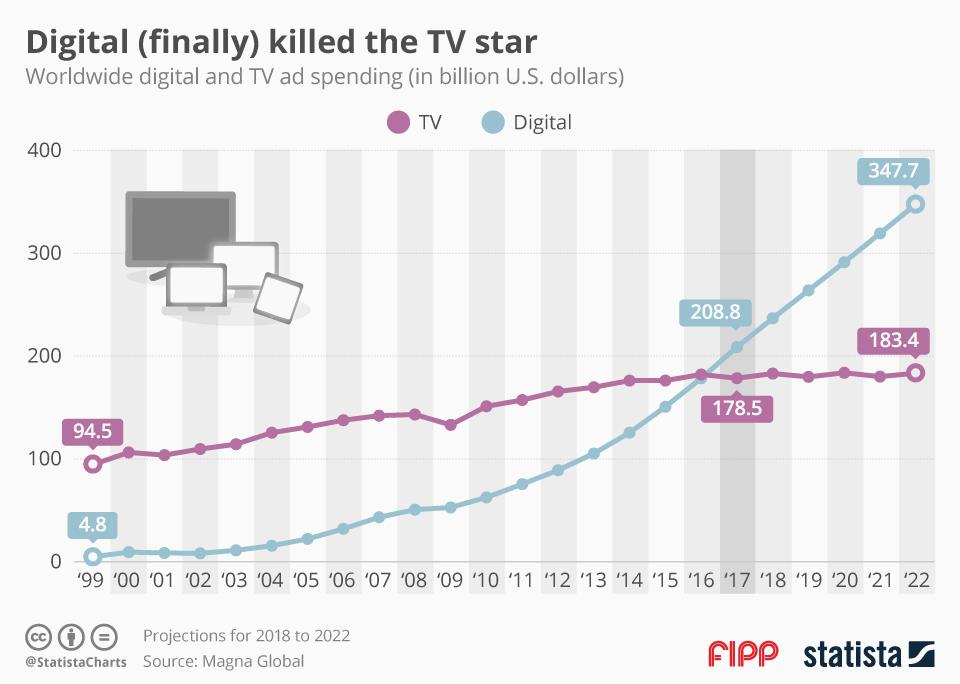
Chart of the week: Digital (finally) killed the TV star
According to data collected by business intelligence agency Magna Global, in 2017, around 209 billion US dollars were invested in to digital ad spend, while TV’s share stood at 179 billion dollars in 2017.
So, there should be the festive feeling in digital publishing, now awash in ad dollars. What stresses many is the distribution of those ad dollars. Indeed, Google and Facebook are snapping up a very big chunk. According to recent data provided by eMarketer, the mighty duopoly “is now expected to rake in a combined 63.1 per cent of US digital ad investment in 2017.” The others are left to squabble over the rest.
Download the chart here.
Source: Statista
More like this
Chart of the week: Media side of ad campaigns grows more important
Chart of the week: Why do consumers break up with brands?
Chart of the week: Where ad spend is growing most
Chart of the week: Where will the marketing money be spent in 2018?