From the 2014 Innovation Report: Should big data be in the driver’s seat?
An extract from the FIPP Innovations in Magazine Media 2014 World Report.
The idea of big data is not new: in the 1949 George Orwell classic 1984, Big Brother’s oppressive rule was founded on an extensive knowledge base; in the 1956 Phillip K. Dick short story, Minority Report, governmental knowledge is so extensive it can predict a given individual’s actions at some future time.
While we are far from being able to mine as much data as Orwell’s Inner Party or predict future actions like Dick’s “precog” mutants, we are approaching a new dawn in predictive data metrics and analysis.
Consider that in 2012, retail giant Target created an algorithm to identify pregnant customers in their second trimester using purchase data (such as the buying of prenatal vitamins) and other factors, some purchased, some collected by the company itself.
This sort of market research is commonplace in retail — although “Target has always been one of the smartest at this,” according to Eric Siegel, chairman of Predictive Analytics World, an analytics conference. “We’re living through a golden age of behavioural research. It’s amazing how much we can figure out about how people think now.”
Not so long ago, all publishers had to go on were simple circulation numbers. Up here, down there… but why? Who was reading what? Who knew?!
Until recently, the idea of collecting digital data within a publishing framework was so rudimentary or unfocused as to be useless.
“We know next to nothing about how people consume our content, whether we’re publishing in the right way, whether all the time and effort we’re putting into creating these interactives actually work,” Aron Pilhofer, head of the New York Times’ new newsroom analytics team, told journalism.co.uk. “The only way you can do that is through analytics, understanding how people are interacting, what they’re doing with your content.
“When you’re spending so much time, you’re putting so many resources into these projects and into these pieces you really shouldn’t be publishing blind,” he said.
But Pilhofer doesn’t believe data should drive every editorial decision. He and other editors still believe in the old-fashioned gut instincts of great editors that have made great magazines.
“I don’t think everything should be approached that way,” Pilhofer said. “I’m not even sure most things should be approached that way, but having the ability to make data-driven decisions, I think is super important.”
And data analytics firms agree.
In an interview about the use of big data in industry, Forbes writer Rich Karlgaard asked Tony Fadell, founder and CEO of Nest Labs, a maker of “smart” thermostats: “Does big data help Nest design its thermostats?”
“No,” said Fadell. “Great products come from strong points of view. You design them for yourself. You say ‘no’ to most of the features that data says you’ll need. Steve Jobs was brilliant at saying ‘no’. But big data shows how people use your product in ways you hadn’t expected. It provides terrific insight into how you might improve the product’s software, communicate with customers and build loyalty.”
In magazine publishing, perhaps no one delivers on the power of data like The Atlantic Group. Consider their new product, Quartz: Launched in September 2012, the digital news site provides intelligent content customised via a given consumer’s interaction with the site. Similarly, companies such as Gravity, Contextly, and Sailthru help publishers craft a personalised experience using data gleaned from a consumer’s profile and reading habits.
If you’re unconvinced about the ease with which a well-constructed site can gather data based on your reading habits, pay a little more attention to the advertising blocks showing up on your preferred websites and within your webmail interface — chances are, at least two of the advertisements are for products you’ve searched for online but have not yet purchased.
Observers draw a highly probable parallel between the music industry at the turn of this century and what they call the Intelligent Content movement of today. “[MP3s] meant the end of curated CDs,” wrote Roger Wood and Evelyn Robbrecht in PaidContent. “Now, playlists are compiled and shared with the help of Pandora, Spotify or Songza. Thus magazines and books could soon become the Pandora of dynamic content, with artificial intelligence applets that choose and adapt content, then tailor it to the reader’s context and taste. We see the beginnings of this with Flipboard, but it will only get more advanced.”
In other words, publishers will throw everything at us, see what we like, then watch and wait and follow us on our virtual reading paths.
What does this mean for magazine publishing? Data-driven content — and the context in which it’s consumed — are incredibly important to creating work that is engaging and has a high ROI. For some, this means predictive algorithms and analysis (as with Target); for others, it’s interpreting analytics via a service such as Metamarkets. McClatchy — the third largest US newspaper company — believed so stongly in the power of analytics that it purchased analytics firm TruMeasure last year.
“This is another important investment in McClatchy’s digital future,” said Christian A. Hendricks, McClatchy vice president of interactive media. “ROI and performance assessment are now front and centre in almost every conversation we have with small and medium-sized businesses. With the addition of TruMeasure to our product and services portfolio, our advertising sales consultants are now positioned to not only talk about results, but also to show customers how each component of their advertising spend is performing.”
But having the data and knowing which are the wheat and which the chaff is no easy feat.
Thanks to tools like Google Analytics and a myriad of other data gathering and analytics programs, publishers have access to data on just about every conceivable user interaction, ranging from which stories they read and whether they shared it to the time they spent on the site and how often they came back.
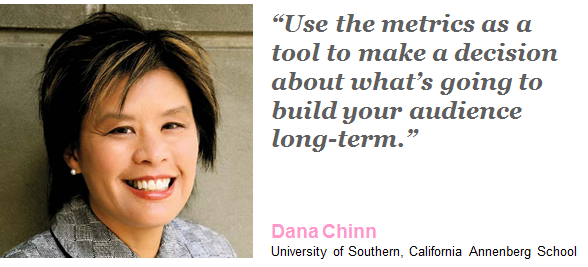
However, industry experts warn not all data are conducive to accurately predicting reader behaviour. “Just because you can measure something, doesn’t mean you should use that data for decision-making,” University of Southern California Annenberg School media analytics specialist Dana Chinn told NetNewsCheck. “There are so many good and strong metrics, so why waste time and resources — and journalists’ bandwidth for numbers — on weak metrics?”
Chinn and Google believe a “visit” is the best metric because that data contain all of the user’s action on a page.
According to Google, “a visit is a group of interactions that take place on your website within a given time frame. For example, a single visit can contain multiple pageviews, events, social interactions, custom variables, and e-commerce transactions.”
So, watching what readers do on a visit — commenting, subscribing to a newsletter, sharing, buying — gives editors the most complete picture of their readers’ interests and what areas of their site generate the most interaction.
“We’re not saying that news should be driven by metrics,” said Chinn. “We’re saying use the metrics as a tool to make a decision about what’s going to build your audience long-term.”
What data should publishers de-value?
Chinn dismisses “misused metrics,” especially page views and unique visitors. She claims unique visitor data, over-represent readers coming from multiple devices and browsers, while underrepresenting visitors from a shared computer (members of a family, for example).
The current media darling in the realm of data and analytics is The New York Times, where interactive news team head Aron Pilhofer created a newsroom analytics team. The Times, which has had a paywall for three years (Mar. 2011), created its dedicated editorial analytics team to enable the newsroom to mine data and “make data-driven decisions” where appropriate, according to Pilhofer.
The mission of the team is to constantly observe and analyse how readers navigate the site, talk about how the editors want readers to use the site, and then compare the vision to the reality. “Those two things can be amazingly different,” he said.
What to measure is one thing, how to measure is another altogether.
Forbes took a hybrid path: part third party, part bespoke. The magazine employs Chartbeat and Adobe-owned Omniture, alongside its own handmade analytics platform, what chief product officer Lewis D’Vorkin calls his “statistics engine.”
D’Vorkin rattled the newsroom to its core by adding a “public dashboard” to his “statistics engine,” displaying story data for editors, writers and readers to see.
“When we started to do this, staffers would come into my office and ask me to stop counting the data in public because they were a bit embarrassed that maybe a post wasn’t viewed that many times,” D’Vorkin told journalism.co.uk.
“And I said no, we’re going to continue it, because you need to know how you’re doing and it’s transparent for the public as well.”
A feedback loop powering what we do
“Every contributor should know, and every staffer should know, how am I doing?” said D’Vorkin. “I publish a post, how’s it doing? Where’s the traffic coming from? Do people care? Are they interested? How does it compare with the other posts that I’ve done? So we really strongly believe that data is a feedback loop that helps power what we do. “And I want to be really clear a out this. The data informs what we do, it doesn’t rule what we do.”
Despite initial resistance and resentment from some members of the staff, it wasn’t long before they, too, were bitten by the data bug — so much so that when the statistics engine would go down, everyone stopped publishing because they didn’t want to do so blindly.
“The feedback loop had become so important to the people who were complaining about it, that they didn’t want to publish unless they knew how they were doing,” D’Vorkin told journalism.co.uk.
The key measure for D’Vorkin — repeat visitors — is not the same as Chinn’s (visits).
“If someone comes to me once a month, that’s a good thing,” he said, “if someone comes to me twice a month that’s a better thing, if someone visits me three times a month, that’s even better, because that’s a measure of loyalty. And we really track loyalty, that’s very important to us.”
D’Vorkin also uses his “statistics engine” to tie payment to performance for his legion of paid contributors.
“That statistics engine will send that information about the size of your audience to a payments engine that knows the deal that you have with us, and that deal then calculates the money and then – boom – the money will be paid to you,” D’Vorkin explained.

Paying for performance
Is D’Vorkin troubled by paying for clicks? Not at all. “They have to figure out within [their] niche what is the content that people want,” D’Vorkin said. “If someone is covering the hardware business, and they’re not being successful at that, they then can’t write about Kim Kardashian to generate an audience… They have to figure out the specific vertical niche that they’re in. That’s what prevents people from doing the things to generate traffic just to make money, because they must stay within their niche.”
With big data pioneers like Forbes, the Atlantic Group, and The New York Times, it won’t be long before every publisher is as familiar with big data as he or she was about start, stops, and renewals in the good, old print-only days.
Source: FIPP Innovations in Magazine Media 2014 World Report