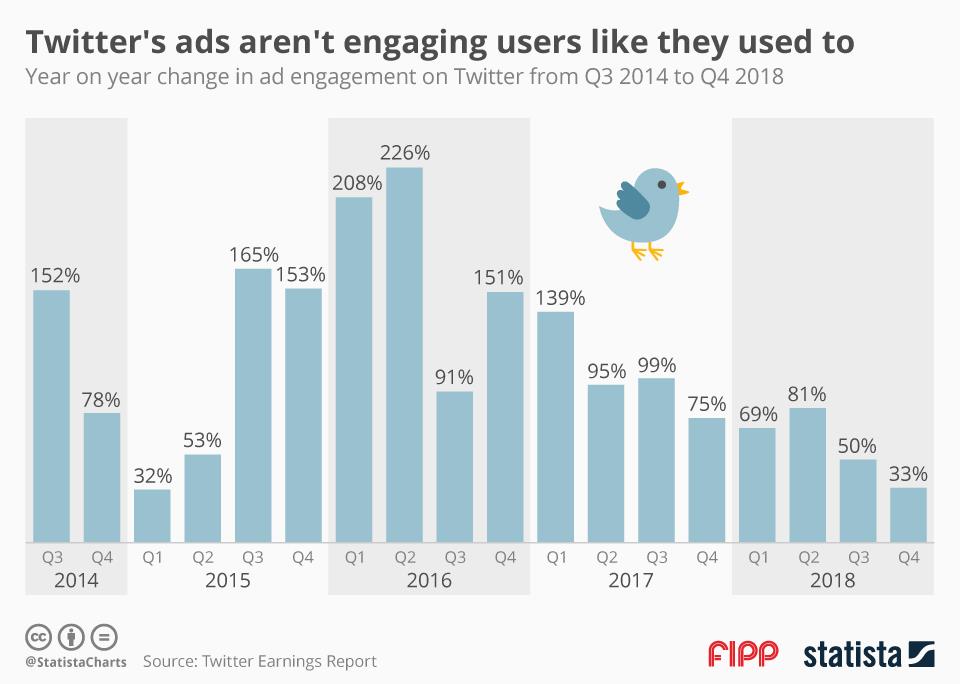
Chart of the week: Twitter’s ads aren’t engaging users like they used to
Ad engagement has grown in Q4 2018, though at a slower rate than previous quarters. Twitter measures ad engagement as any user interaction with a pay-for-performance advertising product, including: expanding, retweeting, liking or replying to a Promoted Tweet, viewing an embedded video, downloading or engaging with a promoted mobile application, clicking on a website link, signing up for marketing emails from advertisers, following the account that tweets a Promoted Tweet, or completing a transaction with an advertising product. The social media platform is known for its sparse character count and incendiary back-and-forth from users. It experienced a huge spike in ad engagement in FY 2016, largely driven by the adoption of auto-play videos.
In the last quarter of FY 2018, total ad revenue totaled US$791 million, which Twitter attributes to increased demand and improved clickthrough rates. The cost per engagement dropped as Twitter continued its expansion into video ads, which often yields higher engagements for the same cost. Ad engagement in FY 2018 did not grow at the same rate as the previous two fiscal years, largely because Twitter has ridden the video wave that pushed ad engagement to its 2016 levels and has not innovated beyond that.
Download the chart here.
Chart by Statista
More like this
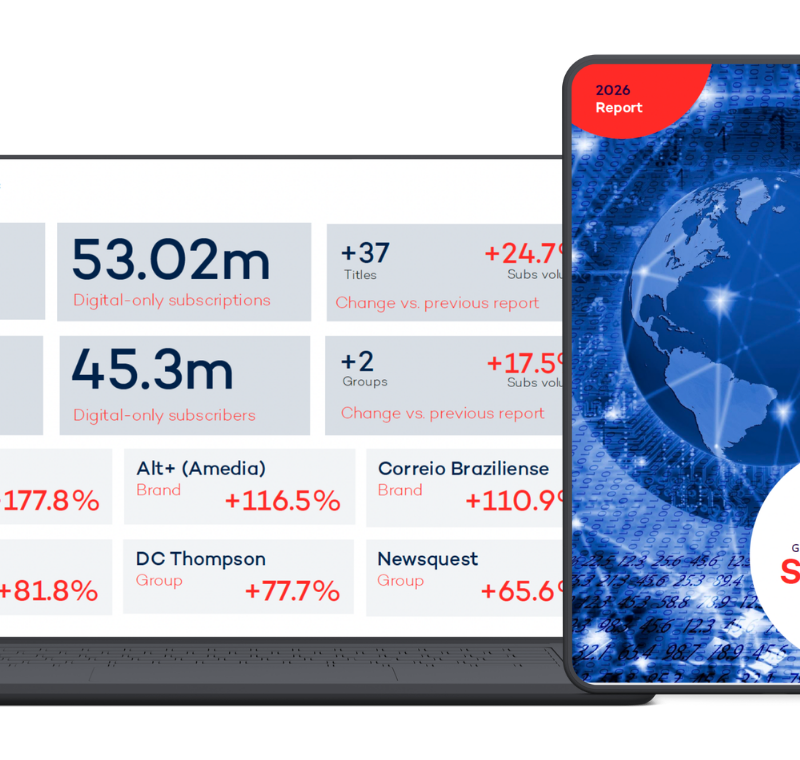
Chart of the week: News industry pivots to subscriptions for 2019
Chart of the week: Where media could benefit from AI
Chart of the week: UK leads European ad revenue for social media
Chart of the week: Podcast loyalty boosts positive attitude towards ads