Data-driven storytelling: Making sense of facts and figures
Maths-anxiety is “a thing”
Maths anxiety has been defined as feelings of “tension and anxiety that interfere with the manipulation of numbers and the solving of mathematical problems in a wide variety of ordinary life and academic situations.” According to a study by researchers at the University of Granada, tension, nervousness, concern, worry, edginess, impatience, confusion, fear and mental block are some of the symptoms of this disorder. For the average person, this means that the very thought of having to interact with numbers makes them queasy.
The power of data
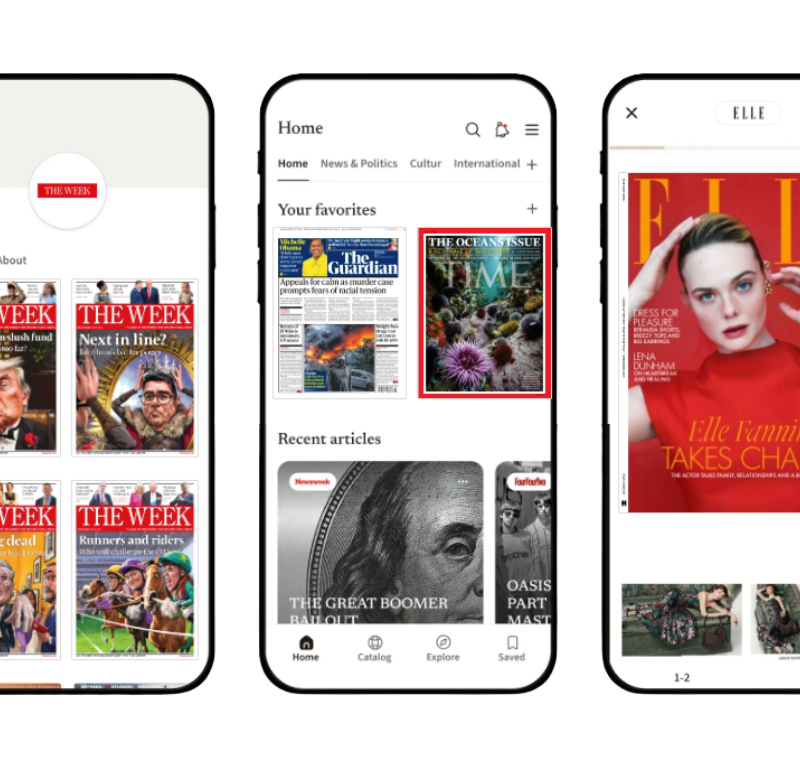
More and more magazines and newspapers, as well as their branded content studios, are recognising the power of using data to identify and tell stories. According to Virtualization and Cloud News, approximately 2.5 quintillion bytes of data are created every day. This number will continue to grow as smartphones, tablets, wearable technology and connected homes produce more and more data.
But for journalists and other writers, the data they really want to access is called “open data.” According to the Open Data Handbook, open data is data that can be freely used, re-used and redistributed by anyone – subject only, at most, to the requirement to attribute. But it’s not just for journalists. In March this year, as part of the 2016 International Open Data Day, cities, states and federal agencies tackled some of their biggest issues using data. From school enrolment to international aid distribution to tracking terrorism, the open data community tackled some of the world’s most pressing issues.
Portland, OR-based journalist Lee Van der Voo who is also the managing director of the non-profit journalism organisation InvestigateWest, told The New School’s, Ashawnta Jackson that journalists have come to see data work as an opportunity to do more with less. “Using open data makes us incredibly more efficient in analysing trends. It helps us look for newsworthy patterns in everything from contract spending in state government to budget analysis, and enables us to look very closely at particular data sets, for example traffic stops made by police or accidents on state highway.”
Bringing meaning to data with storytelling
For the many people afflicted with math anxiety, the growth of data-driven journalism may not be music to their ears. What’s more, according to Jennifer Aaker, Professor of Marketing at Stanford Graduate School of Business, studies show that we are wired to remember stories much more than data, facts and figures. However, when data and story are used together, she said, audiences are moved both emotionally and intellectually.
In his book, Facts Are Sacred, Simon Rogers suggests that data analysis isn’t about graphics and visualisations; it’s about telling a story. “Look at data the way a detective examines a crime scene. Try to understand what happened and what evidence needs to be collected.” According to Rogers, the visualisation will come naturally once the mystery is solved. The focus is the story.
Writing in the Harvard Business Review, Jim Stikeleather cautions that done well, a visualisation should tell a story through the graphical depiction of statistical information. “The visualisation needs to tell a story to the audience. Storytelling helps the viewer gain insight from the data,” he said.
Data-driven storytelling done well
During the final week of last November, The Wall Street Journal published an article each day under the title: Our Demographic Destiny. The seven-part series tries to answer the question: What will the world be like in 2050?
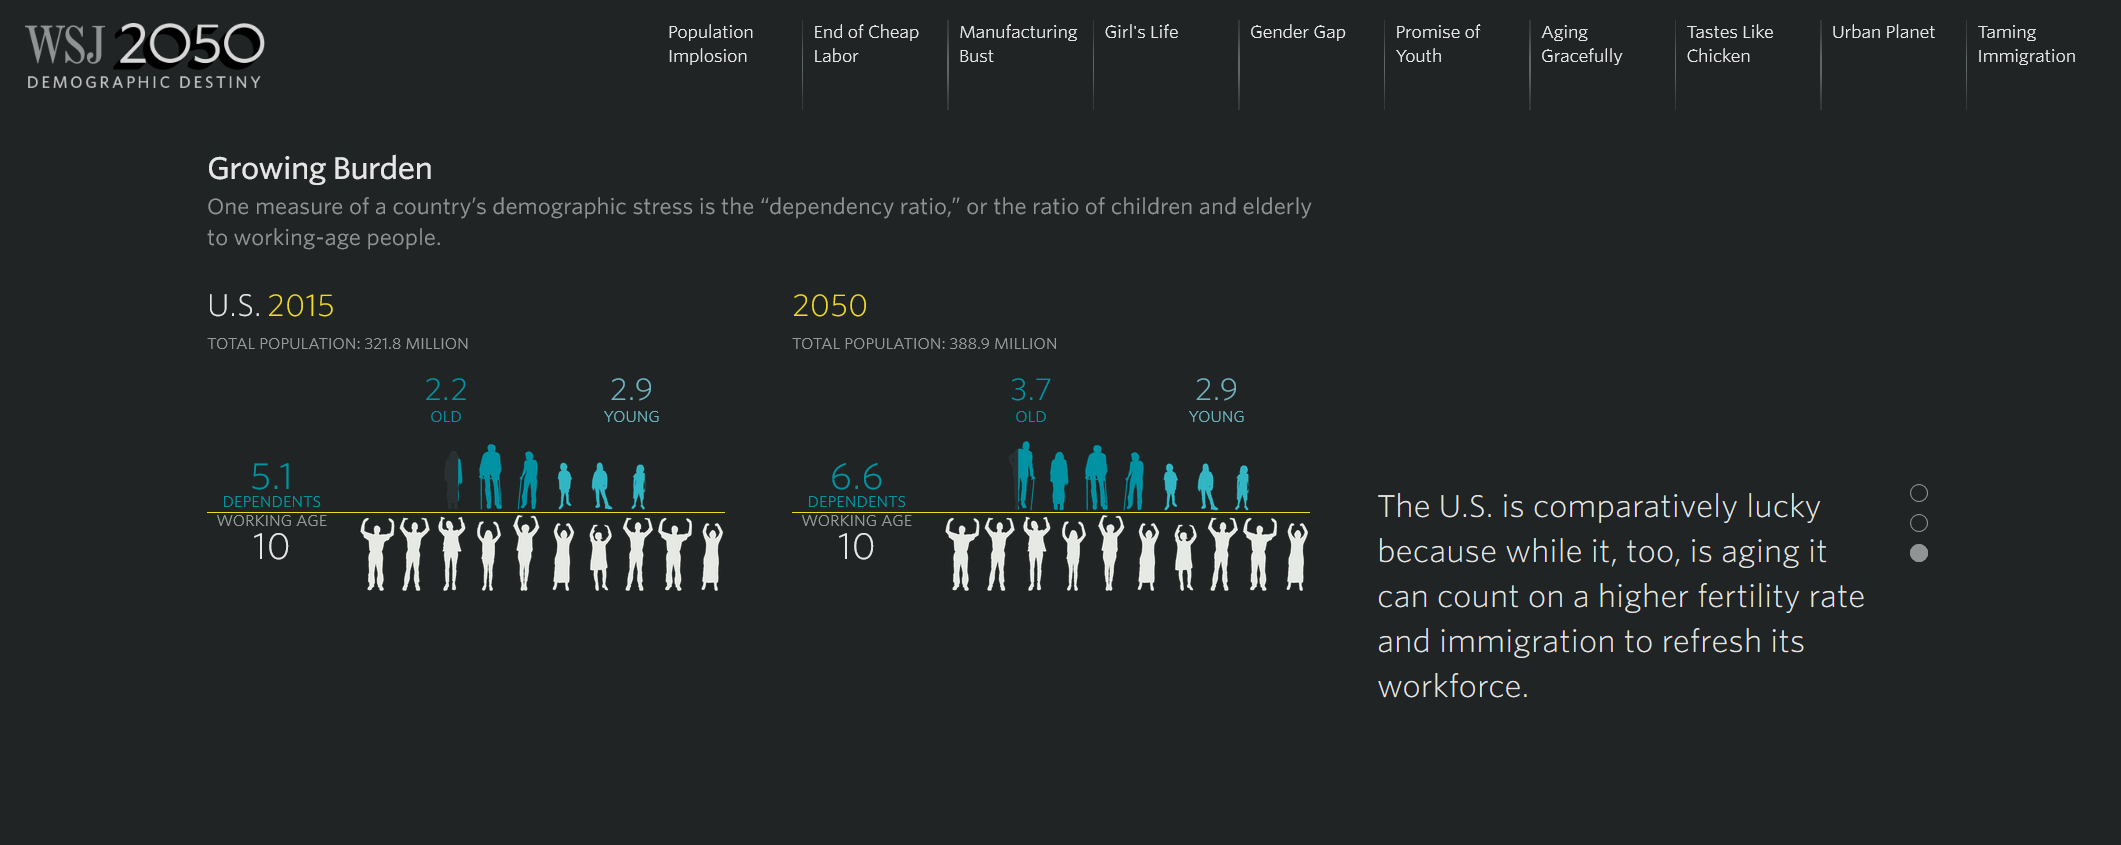
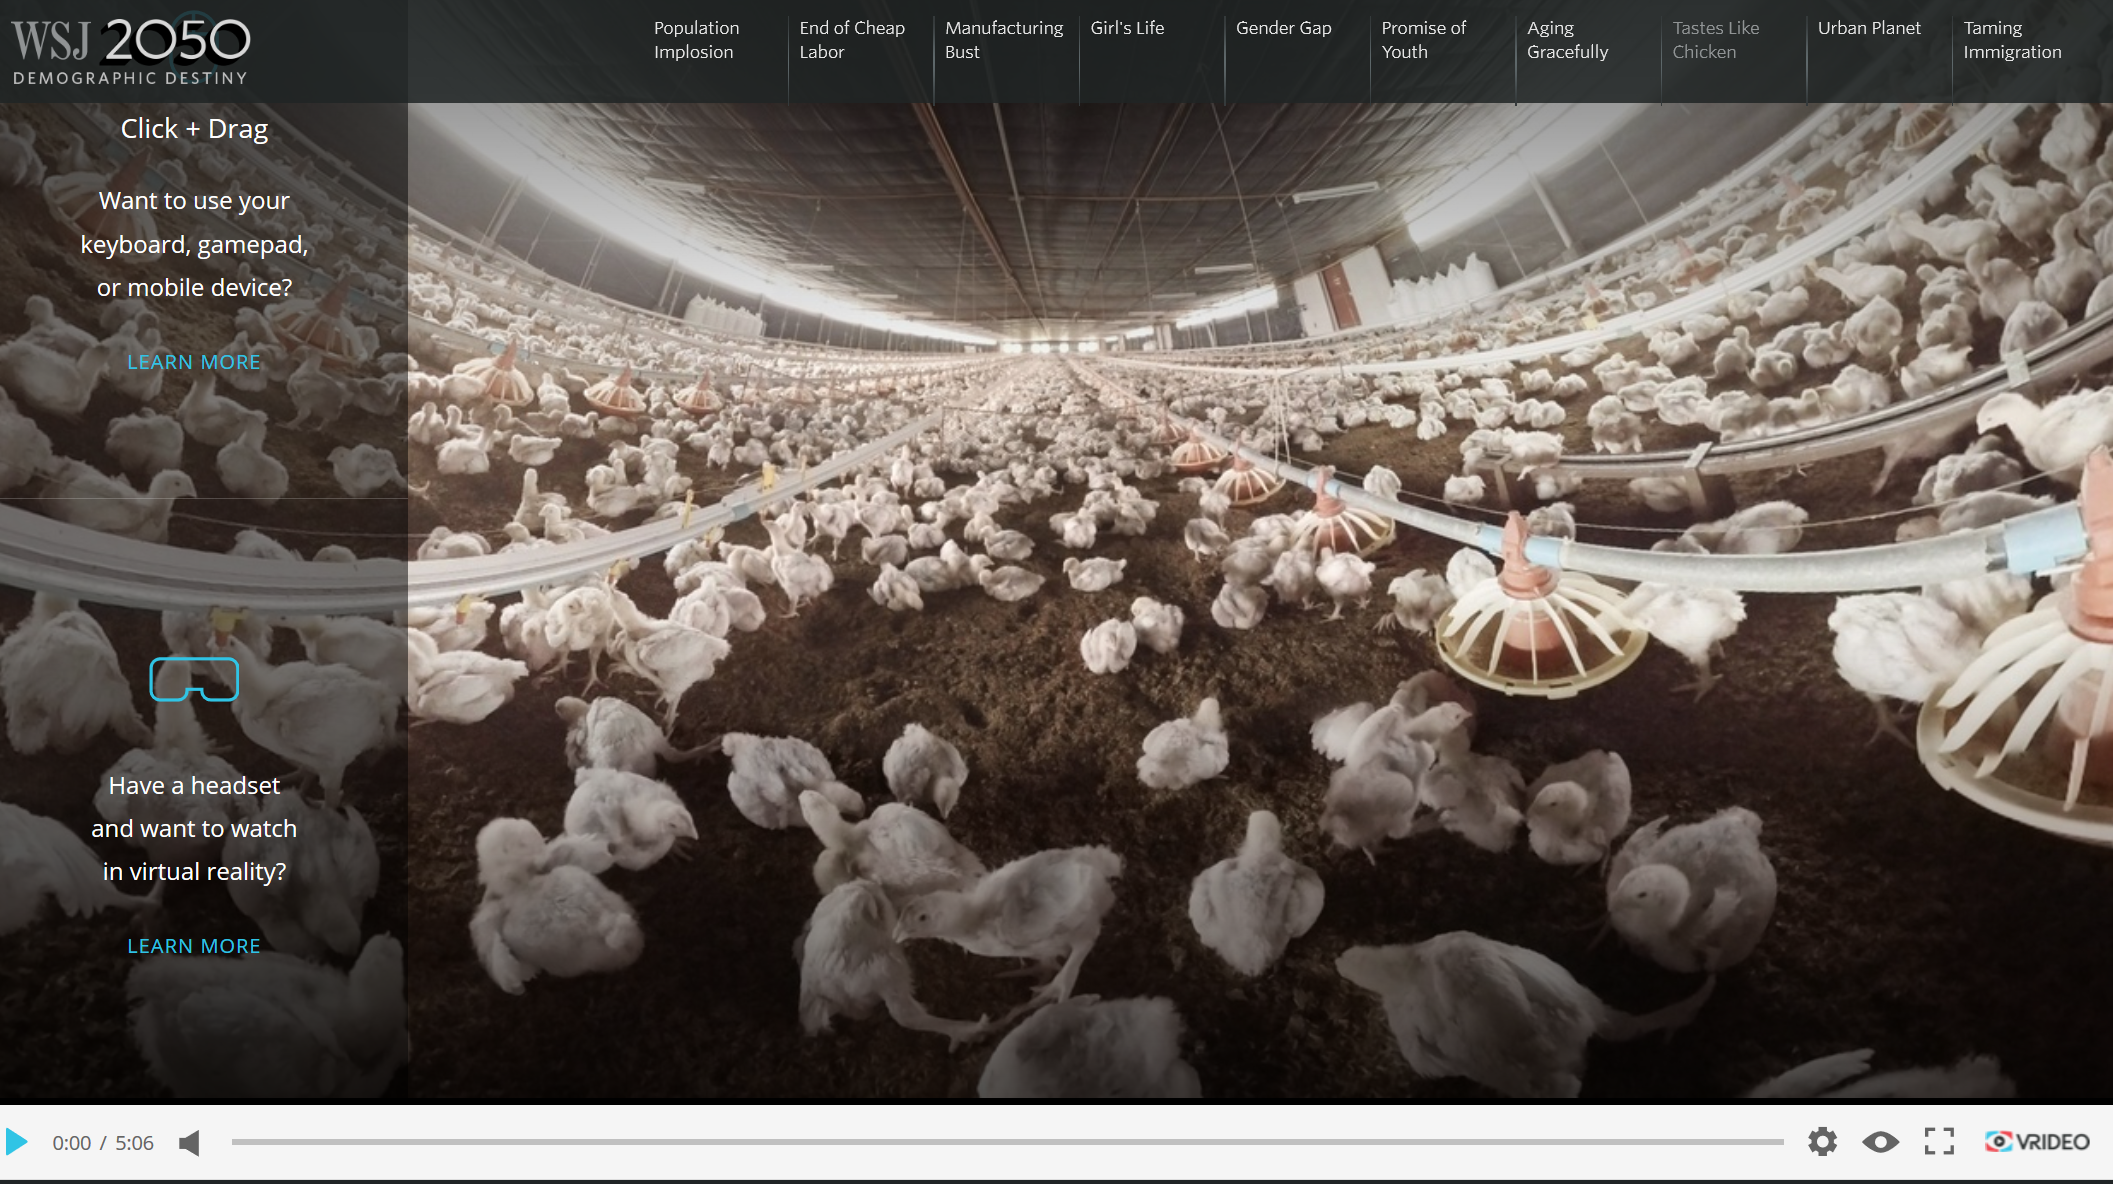
Topics covered included “The end of cheap labor,” “Gender gap” and “Tastes like chicken,” which explored the challenges food producers face in satisfying the world’s appetite for meat. In addition to a rich narrative describing each trend and the people who are impacted, each article included photographs and visualisations of demographics along with companion anecdotes. Put together, the series helped readers envision how we will work, age and live. Readers who have virtual reality (VR) headsets could even watch embedded VR movies or interact with the content using their keyboard, game-board or mobile device.
Data-driven storytelling from south of the border
The power of data to reveal critical stories is poignantly revealed by Mexican newspaper, EI Universal’s piece, Ausencias Ignoradas (Ignored Absences), which put a face on the 4,534 women who have gone missing in Mexico City and the State of Mexico over the last decade. The data journalism team at EI Universal, along with external vendors, undertook the laborious process of scrubbing data they scrapped from official websites, Odisea and Capea, which hold information on missing people but don’t present them in a downloadable format.
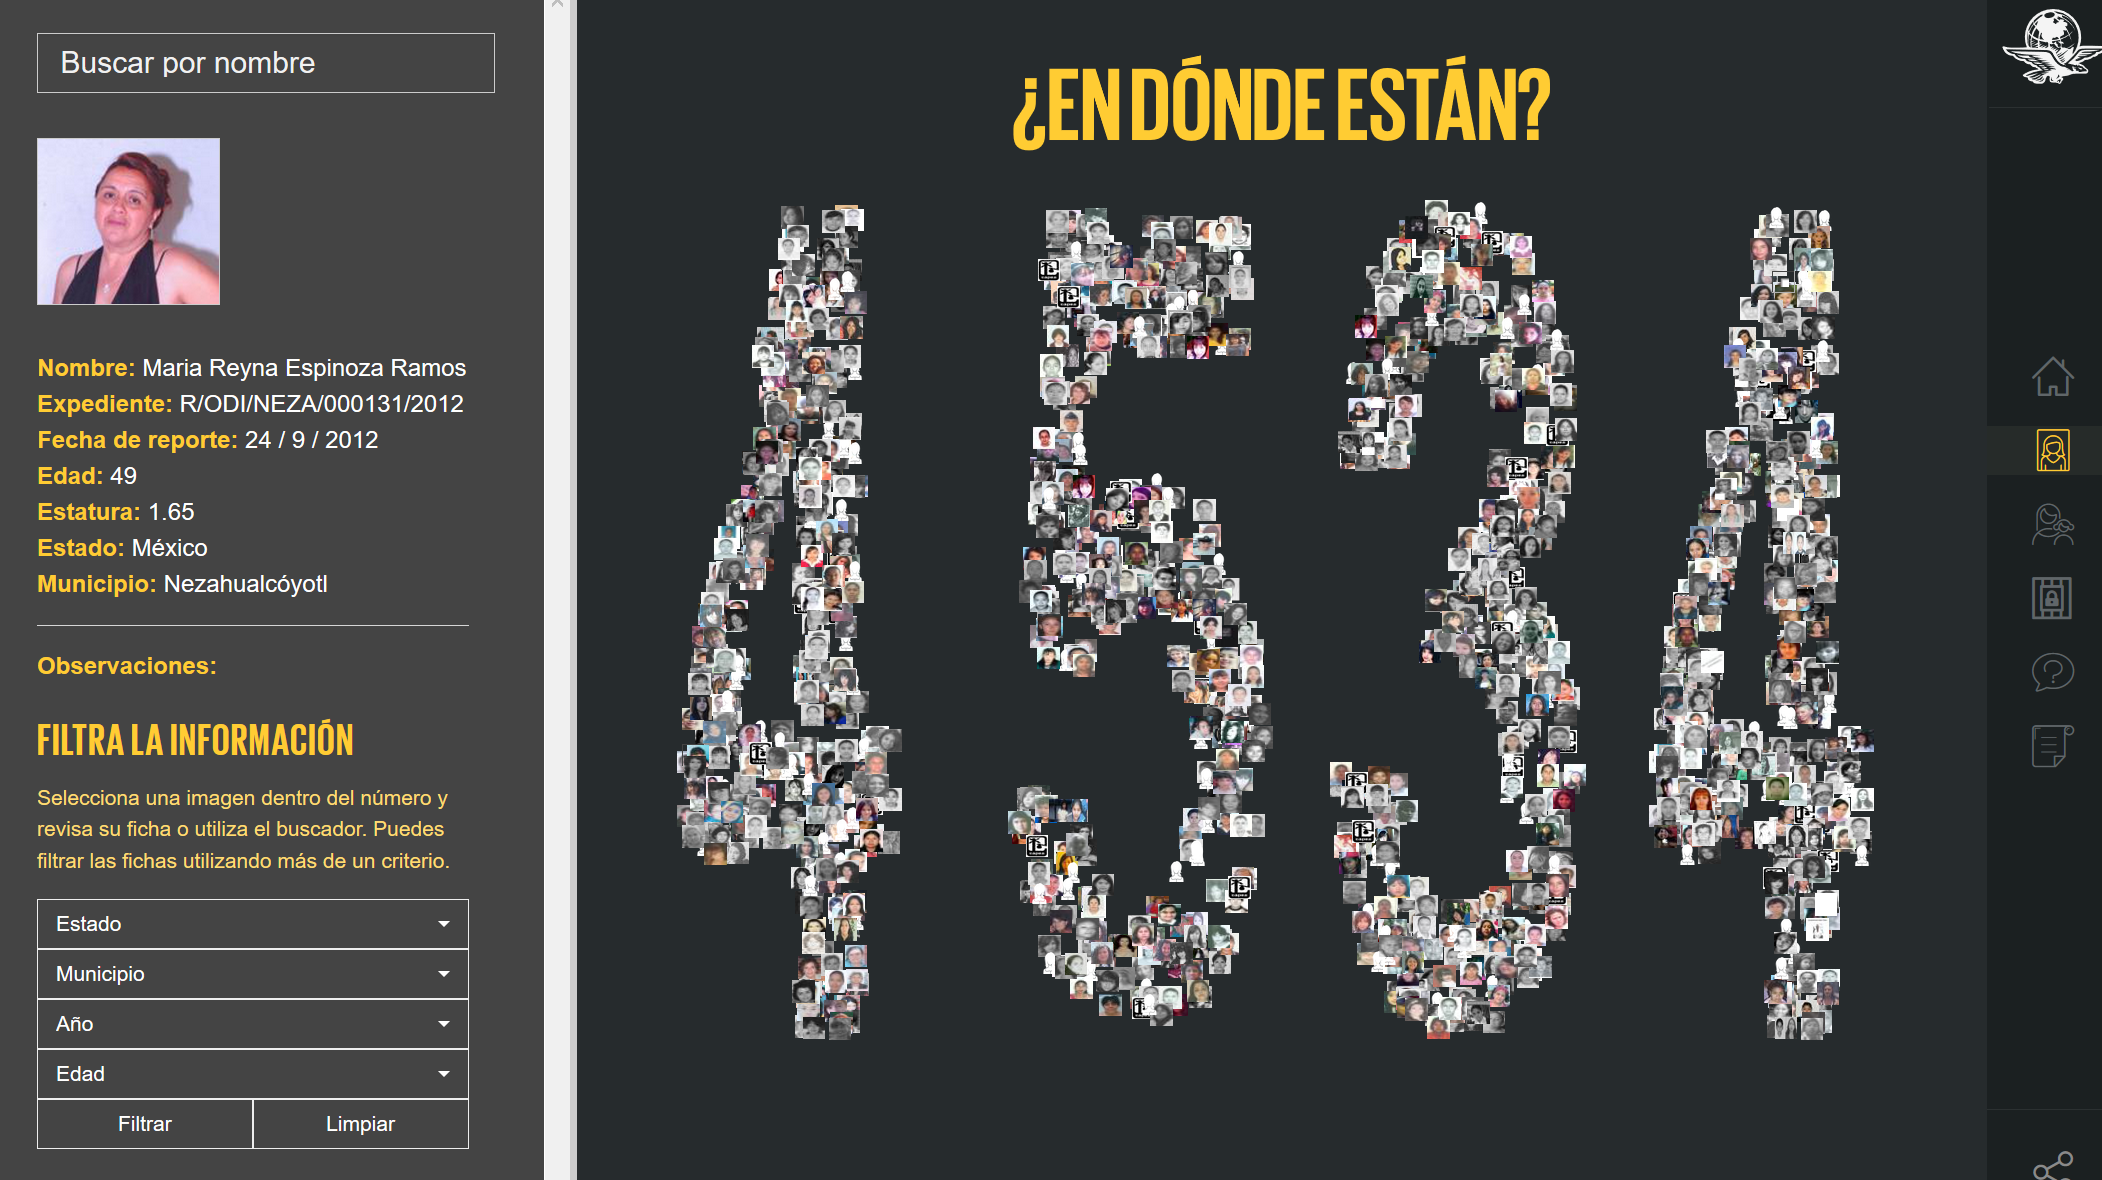
“When it comes to missing people, there isn’t open data,” said Daniela Guazo, from the data journalism team. “Authorities don’t want to upload databases with all these details and all you have online is messy data in non-readable formats such as JPGs that have to be scraped or copied by hand,” she said.
Speaking to the Global Investigative Journalism Network, Guazo said the story took six months including planning, gathering and analysing data, taking pictures, talking to families, writing the article, programming and designing—and it received a strong response from the audience and major organisations.
Words and pictures bring data to life
The world of data offers great opportunities for writers to discover and tell stories that would otherwise have remained hidden. And visual and narrative-based storytelling offers powerful tools that allow writers to explain data in meaningful ways that resonate both intellectually and emotionally with an audience – including those with maths anxiety.
More like this
Buzzfeed’s Ben Kreimer on new tools for spatial storytelling
Trends in media innovation – ways of storytelling with crowdsourcing and virtual reality
Is ‘mobile first’ limiting the potential of interactive storytelling?